
explor is an R package to allow interactive exploration
of multivariate analysis results.
For now on, it is usable the following types of analyses :
| Analysis | Function | Package | Notes |
|---|---|---|---|
| Principal Component Analysis | PCA | FactoMineR | - |
| Correspondance Analysis | CA | FactoMineR | - |
| Multiple Correspondence Analysis | MCA | FactoMineR | - |
| Principal Component Analysis | dudi.pca | ade4 | Qualitative supplementary variables are ignored |
| Correspondance Analysis | dudi.coa | ade4 | - |
| Multiple Correspondence Analysis | dudi.acm | ade4 | Quantitative supplementary variables are ignored |
| Specific Multiple Correspondance Analysis | speMCA | GDAtools | - |
| Multiple Correspondance Analysis | mca | MASS | Quantitative supplementary variables are not supported |
| Principal Component Analysis | princomp | stats | Supplementary variables are ignored |
| Principal Component Analysis | prcomp | stats | Supplementary variables are ignored |
| Correspondance Analysis | textmodel_ca | quanteda.textmodels | Only coordinates are available |
For each type of analysis, explor launches a
shiny interactive Web interface which is displayed inside
RStudio or in your system Web browser. This interface provides both
numerical results as dynamic tables (sortable and searchable thanks to
the DT package) and interactive graphics thanks to the scatterD3 package. You can
zoom, drag labels, hover points to display tooltips, hover legend items
to highlights points, and the graphics are fully updatable with
animations which can give some visual clues. You can also export the
current plot as an SVG file or get the R code to reproduce it later in a
script or document.
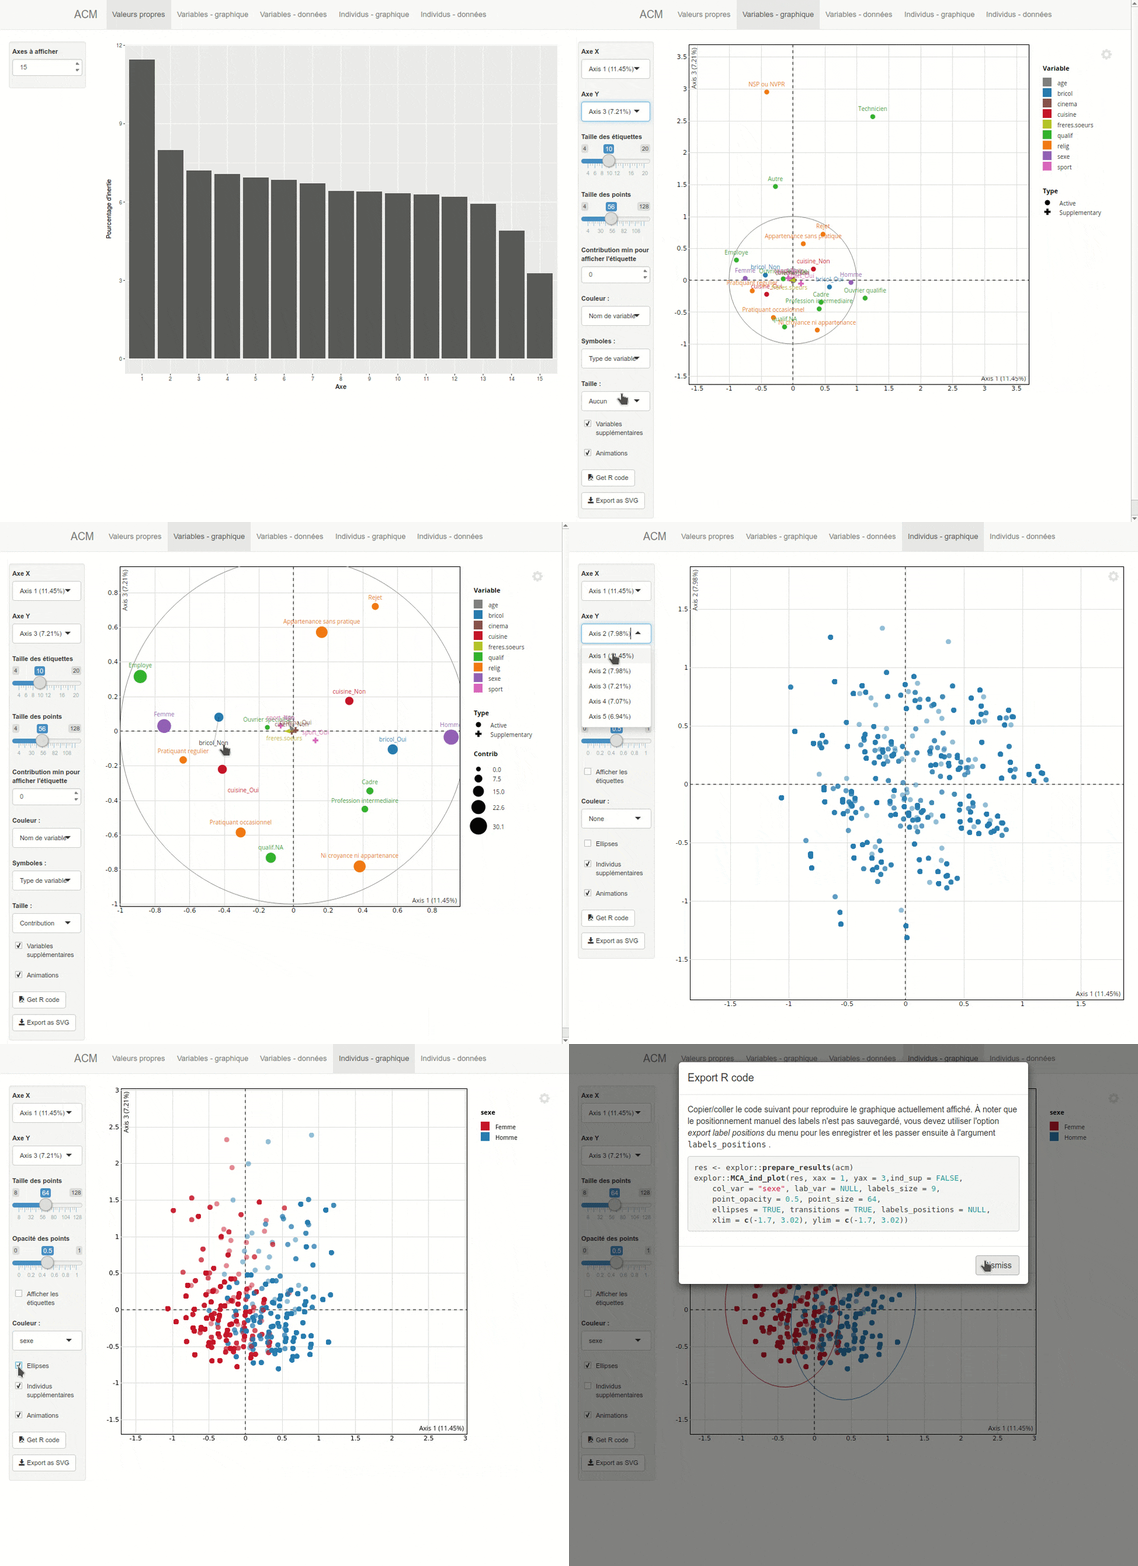
Here is a preview of what you will get. Note that the interface is available both in english and french, depending on your locale :

To get the stable version from CRAN :
install.packages("explor")To install the latest dev version from GitHub :
install.packages("remotes")  # If necessary
remotes::install_github("juba/scatterD3")
remotes::install_github("juba/explor")
Usage is very simple : you just apply the explor
function to the result of one of the supported analysis functions.
Example with a principal correspondence analysis from
FactoMineR::PCA :
library(FactoMineR)
library(explor)

data(decathlon)
pca <- PCA(decathlon[,1:12], quanti.sup = 11:12, graph = FALSE)
explor(pca)
Example with a multiple correspondence analysis from
FactoMineR::MCA:
data(hobbies)
mca <- MCA(hobbies[1:1000,c(1:8,21:23)],quali.sup = 9:10, quanti.sup = 11, ind.sup = 1:100)
explor(mca)Two vignettes are provided for more detailed documentation :
Depending on your system locale settings, the interface is displayed either in english or in french (other languages can be easily added).