
VOSONDash is an interactive R Shiny web application for the
visualisation and analysis of social network data. The app has a
dashboard layout with sections for visualising and manipulating network
graphs, performing text analysis, displaying network metrics and the
collection of network data using the vosonSML R package.
VOSONDash is an R package and must be installed before
the app can be run.
Install the latest release on CRAN (v0.5.7):
install.packages("VOSONDash")Install the latest release via GitHub (v0.5.7):
install.packages("https://github.com/vosonlab/VOSONDash/releases/download/v0.5.7/VOSONDash-0.5.7.tar.gz",
  repo = NULL, type = "source")
Install the latest development version (v0.5.7):
# library(devtools)
devtools::install_github("vosonlab/VOSONDash")
Once the VOSON Dashboard package is installed and loaded the Shiny
web application can be run from the RStudio console using the
runVOSONDash() function.
library(VOSONDash)
runVOSONDash()When run the VOSONDash app will check that all of the R
packages that are required to make it work are installed. It is likely
that some packages will be missing and the app will print a message
indicating the missing packages and a command that can be used to
install them.
For example:
> runVOSONDash()
=================================================
VOSONDash v0.5.7
...
Checking packages...

Error: Required packages missing.
- shinyjs
- visNetwork

Please install required packages before using VOSONDash:
install.packages(c("shinyjs", "visNetwork"))
The missing packages can be installed using the above
install.packages command.
After installing required packages and running again the
VOSONDash Shiny app will open up in the default web
browser.
VOSONDash features an intuitive web interface with a
section for ‘Analysis’ of graph data loaded from igraph objects and a section for the
‘Collection’ of social media data using vosonSML.
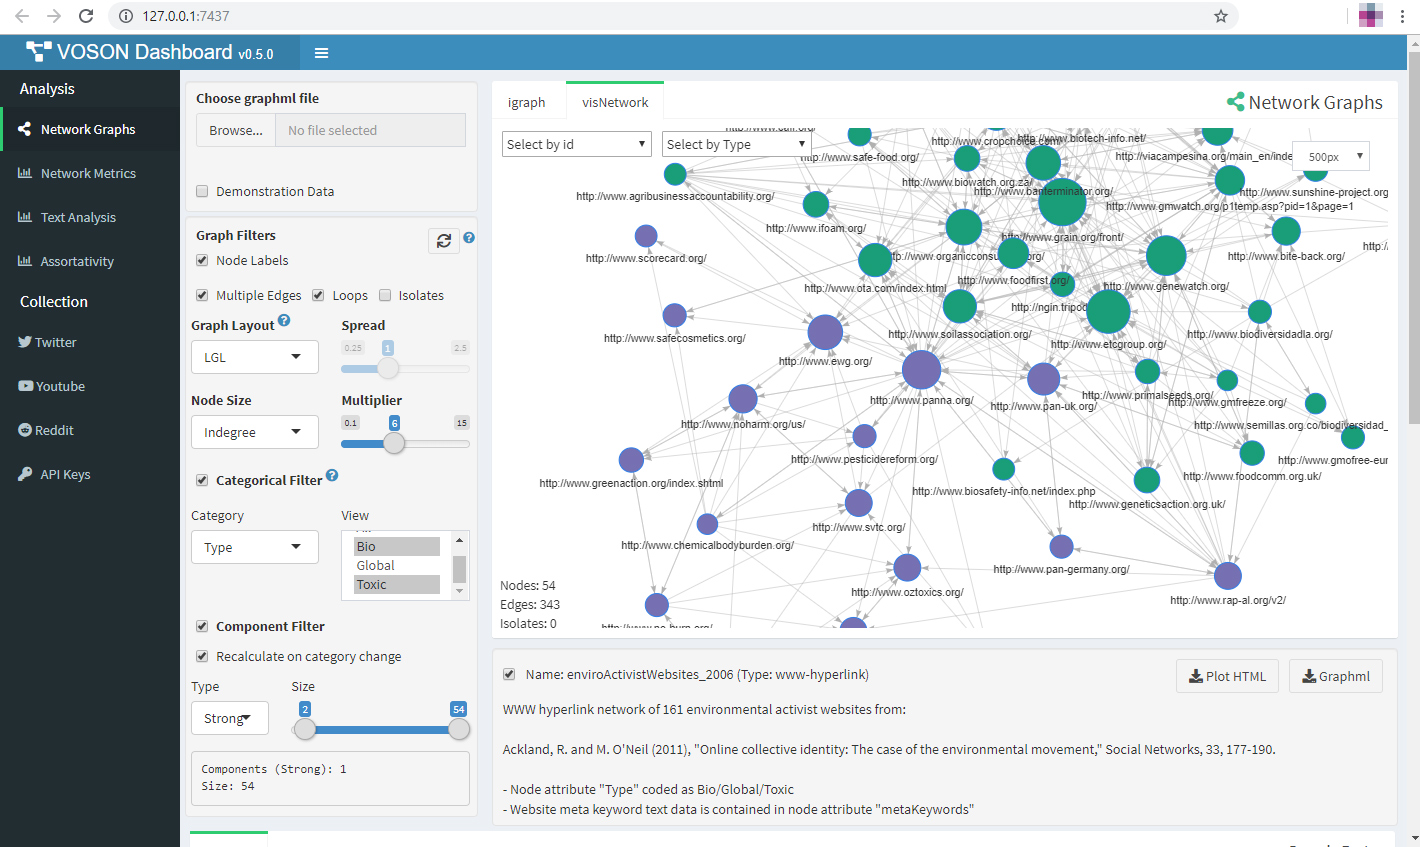
Network and text analysis of graph data.

Figure 1. Environmental activist site hyperlink network loaded from a
graphml file and plotted by the visNetwork
package.
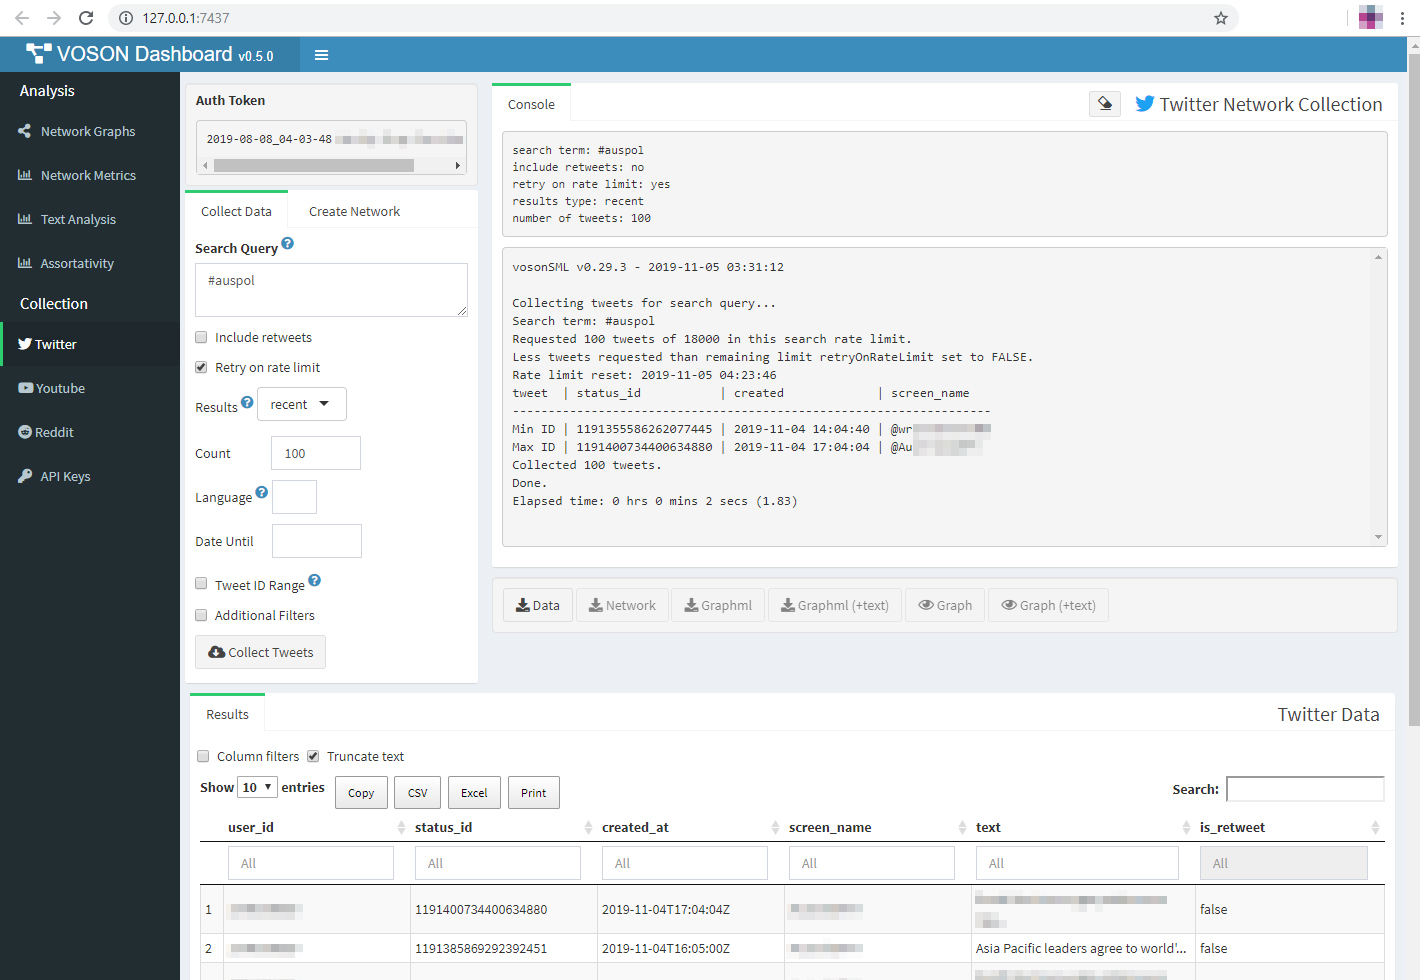
Graphical interfaces for collecting network data from social media API’s.

Figure 2. Collection of recent #auspol tweets and
generation of an actor network with the vosonSML
package.

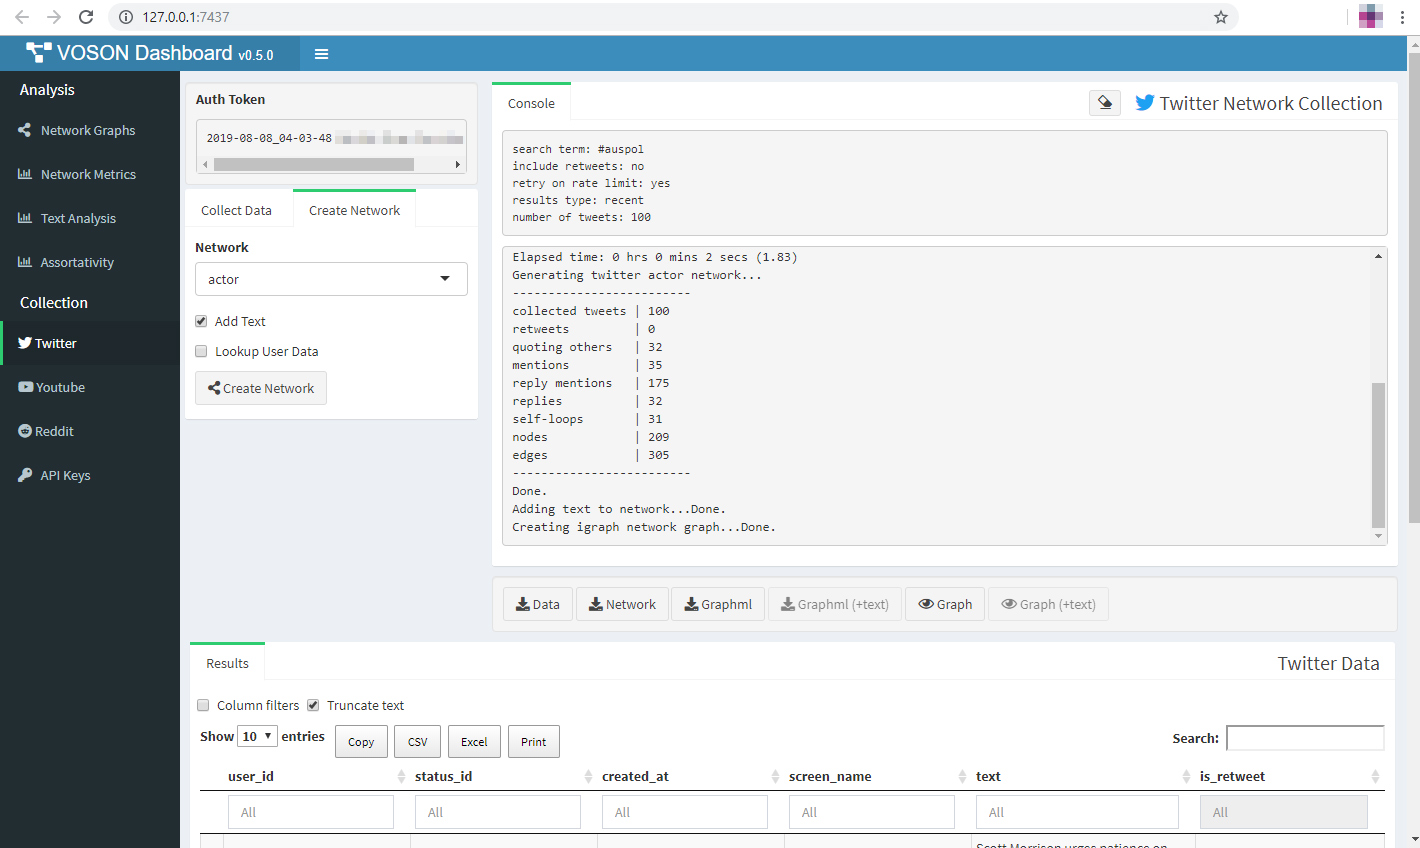
Figure 3. Create an actor network and add tweet text to the network.

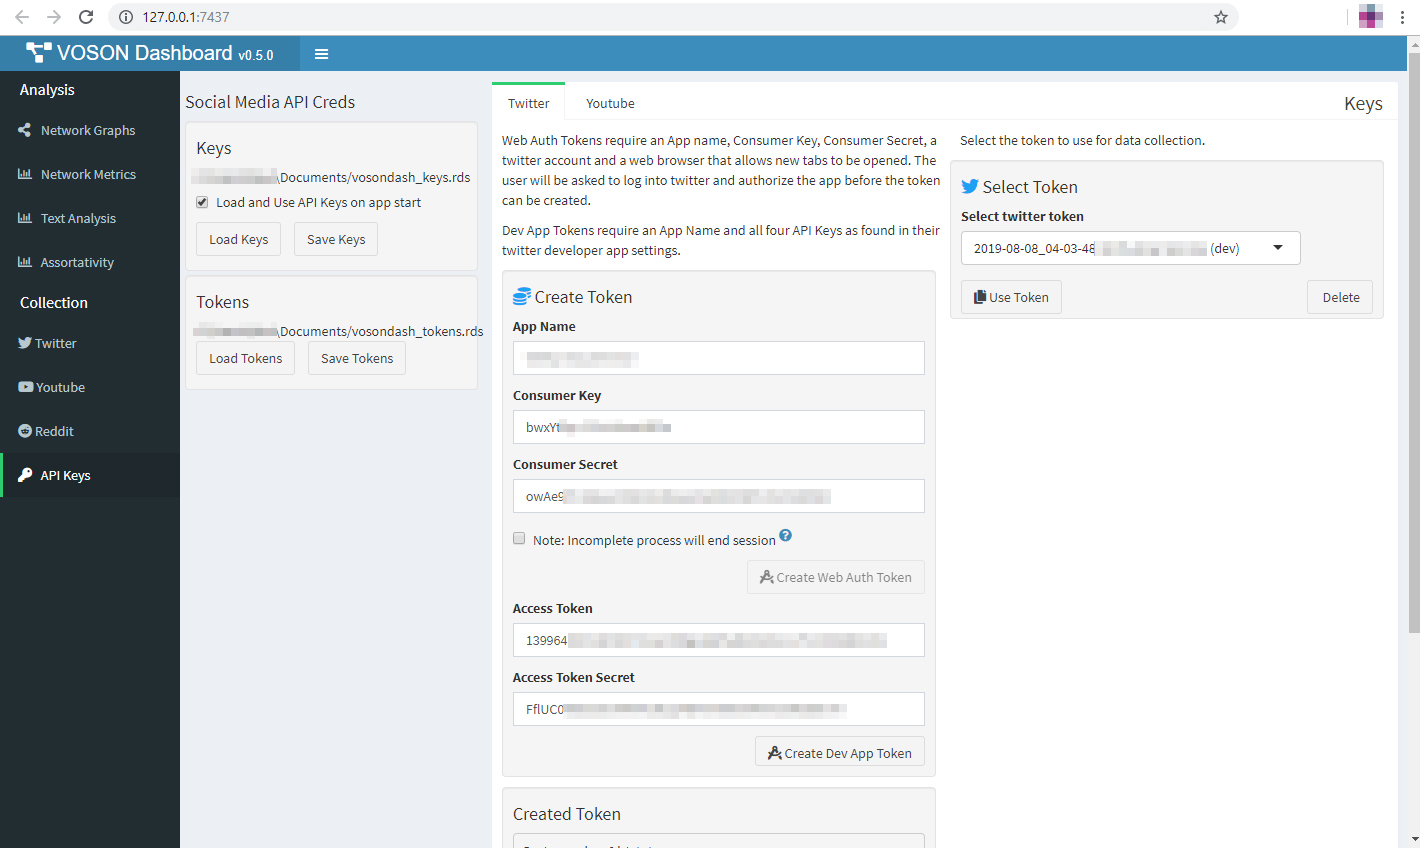
Figure 4. Twitter API token creation and selection.
This application would not be possible without key packages by other authors in the R community, particularly the shiny, shinydashboard, DT and shinyjs packages. Graph visualisations created with igraph and visNetwork, and text analysis with support from tm, SnowballC, wordcloud and syuzhet packages.